Virginians give their local public-school districts high marks, respond to Gov. Glenn Youngkin’s (R) control over public schools, and rate gubernatorial performance so far in a new statewide survey from the Center for Leadership and Media Studies at the University of Mary Washington. The 1,000-person annual poll of Virginia adults was conducted for the center by Research America Inc. Sept. 6-12.

Asked to grade their local school districts on an A-to-F scale, 40 percent of Virginians surveyed gave them an above average grade of A or B, and 26 percent gave them a C. Only 16 percent of Virginians gave their local school districts unsatisfactory letter grades (D or F).
There were some partisan differences. Among survey respondents who identified as Democrats, 20 percent gave their local districts an A, compared to 10 percent of independents and 8 percent of Republicans. Seven percent of Republicans and independents gave their local school districts an F, compared to 3 percent of Democratic respondents.
The survey also identified regional differences. Respondents in Northern Virginia were most likely to give their schools an A or B (16 percent and 44 percent respectively). In the western part of the commonwealth, a traditionally Republican region, 8 percent gave local schools an A and 17 percent gave them a B, the lowest percentages among the five regions.
A grade of F was rare in Northwest Virginia, where only 3 percent said their local schools were failing. Other Virginians also were sparing in their use of an F grade, with only 6 or 7 percent of respondents in other parts of the state ready to fail their local school districts.
When asked about the governor’s level of control over education, 41 percent said he should have less power to control education and 25 percent said he should have the same level of power he has now. Only 17 percent of those surveyed favored more gubernatorial power over public-school education in Virginia.
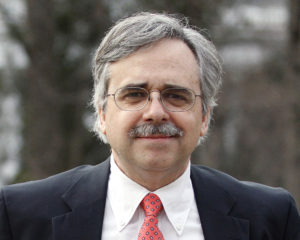
“This survey demonstrates, once again, that the loudest voices at school board meetings are unrepresentative of overall public opinion in the commonwealth,” said Stephen J. Farnsworth, professor of political science at the University of Mary Washington and director of UMW’s Center for Leadership and Media Studies. “The large number of Virginians who say that their local schools are doing an excellent or at least a good job suggests that the governor would be wise to tap the brakes on some of his more controversial plans to re-shape public education.”

Farnsworth also noted that as a candidate during 2021 and as governor, Youngkin has focused on schools, including the content of education instruction relating to racial matters. The statewide survey was completed before the release on Sept. 16 of Youngkin’s new policy proposals about transgender students, a controversial matter that may end up in the courts. A number of school districts, particularly in suburban areas, have been roiled by contentious public hearings in recent years, often about matters of health, race and sexual identity.
The somewhat critical assessments of the governor’s approach to education policy come despite overall positive marks for Youngkin’s time in office. Forty-five percent of those surveyed approved of Youngkin’s performance as governor so far, with 30 percent disapproving. In contrast, Virginians were more critical of President Biden, who received 40 percent approval and 49 percent disapproval in the survey. The remaining respondents said they were unsure about these two political figures.
Youngkin’s net approval score of plus 15 was somewhat lower than that of former Gov. Ralph Northam, who during his first year had a plus 31 net approval rating in the September 2018 UMW statewide survey. But the current governor’s score was close to that of former Gov. Terry McAuliffe, who had a plus 13 net approval score during his first year in office in a September 2014 UMW statewide survey
“Virginians tend to like their governors, particularly during their first year in office,” Farnsworth said. “And governors usually are much more popular than presidents are in Virginia, regardless of which party controls the governor’s mansion and the White House.”
Survey Information:
The University of Mary Washington’s Virginia Survey Fall 2022 was conducted by Research America Inc. from September 6 to 12, 2022. The total sample included 1,000 Virginia residents, including 819 registered voters and 705 likely voters. Part of the sample (630) was contacted by phone (72 percent cell, 28 percent landline), and part of the sample (370) was contacted online. All interviews were in English. Statistical results are weighted to correct known demographic discrepancies, including age, gender and race/ethnicity. The margin of error on the total sample is +/- 3.1%. The margin of error on the Likely Voters portion of the sample is +/- 4.1%.
For a more in-depth look at survey results, see Topline and the Education Cross Tabs report, or read the Sept. 27, 2022 release, Voters Motivated in Midterm Elections According to New Statewide Survey.
For further information, contact Professor Farnsworth at sfarnswo@umw.edu.